APA 7th, part I: Improvements in Data Transparency

Hi Ma! I’m in the APA 7th Edition publication manual.

apa 7

Thanks to Rose Sokol-Chang, Anne Woodworth and Emily Ayubi, I had a chance to give my input to a number of issues while it was in production.

For one, I’m happy that in line with my suggestions, they sharpened up the conflict of interest definitions (section 1.20, p. 23). Financial interests, which can involve authors, editors or reviewers, are distinguished from personal connections, which are of concern to editors and reviewers handling authors’ work. Differences of opinion are not per se conflicts, but advice is given to handle this issue objectively. Editors are encouraged to set policy on such issues as the time frame beyond which a past academic relationship is no longer a conflict.

Also, the new edition, with my input, clarifies the ethics of data sharing in previous APA policy (section 1.14, pp. 13-16). Let’s talk more about that.

For science to be self-correcting, scientists have to be able to check the data that published conclusions are based on. At the same time, we also want to limit the vexatious abuse of this process, and to give authors confidence that the data will only be used for checking the accuracy of their article. These principles guided me in advising how the policy could be improved, inspired by breakdowns in function of the previous policy and by experience with controversial cases as an editor. Here are some highlights that made it to the Manual.

  • Who counts as a “qualified professional?” (Accountability matters.)
  • What are reasonable uses of data to confirm the conclusions of the original paper? (Focus on verifying the conclusions, including the possibility of approaching them with alternative analyses).
  • What are special considerations when dealing with proprietary data, and data based on proprietary methodologies? (Editors need to decide how they act when they get a paper that would not exist if the data had to be shared).
  • How are the costs of data transmission to be assessed? (According to a reasonable local rate that covers the actual job.)
  • What are the consequences of failing to share data on the request of an editor? (Potentially, retraction or expressions of concern about the article).

The policy also asks the requester more specifically to bear the costs of sharing data over and above any preparations needed to make the data usable internally within an institution. In other words, it should always be the researcher’s responsibility to keep their data in good shape in case they get hit by a bus or decide to enter a hermitage. You, or I, may be slack on this responsibility at any given moment, but that doesn’t change whose responsibility it is.

What would this mean in practice? Well, if I ask for a data set, and you charge me $100 an hour to have someone change the variable name into something that matches up with the analyses you reported, that is just something you should have done in the first place. If I ask for you to translate open-ended responses from your source files from Chinese into English, that’s a different story. It’s more justifiable that I should be stuck with the bill, or just find someone to do the translation on my end.

Two more improvements I wasn’t involved in: encouragement for editors to adopt open data policies and data badges, and a section on sharing qualitative data. Overall, this expanded section gives guidance to make science published under APA rules more reliably transparent.The other section of the Manual I was consulted on concerned the implications of APA’s long-standing ethical policy about full reporting. The uptake of that advice in the final manual is more complicated, and leads me into some thoughts about how standards can be enforced in publishing. That’s another blog post, coming soon!


Justify Your Alpha … For Its Audience

In this light, it seems pertinent to ask, what is the fundamental purpose of a scientific publication? Although it is often argued that journals are a “repository of the accumulated knowledge of a field” (APA Publication Manual, 2010, p. 9), equally important are their communicative functions. It seems to us that the former purpose emphasizes perfectionism (and especially perfectionistic concerns) whereas the latter purpose prioritizes sharing information so that others may build on a body of work and ideas (flawed as they may eventually turn out to be).

(Reis & Yee, 2016)

There’s been a pushback against the call for more rigorous standards of evidence in psychology research publishing. Preregistration, replication, statistical power requirements, and lower alpha levels for statistical significance, all have been criticized as leading to less interesting and creative research (e.g., Baumeister, 2016; Fiedler, Kutzner, & Krueger, 2012; and many, many personal communications.) After all, present-day standards completely exclude from the scientific record any individual studies that do not meet significance. So, wouldn’t stricter standards expand the dark reach of the file-drawer even further? I want to show a different way out of this dilemma.

First things first. If creativity conflicts with rigor, it’s clear to me which side I chose 30 years ago. By deciding to go into social science rather than humanities, I chose a world where creativity is constrained by evidence. If you want to maximize your creativity, you’re in the wrong business. In a simulation of publishing incentives, Campbell and Gustafson (2018; pdf) show that adopting a lower threshold for significance is most helpful in avoiding false positives when studying novel, unlikely, “interesting” effects. It is precisely because counterintuitive ideas are likely to be untrue that we need more rigor around them.

bunny
Maximum creativity

One call for increased rigor has involved lowering significance thresholds, specifically alpha = .005 (old school, for the hipsters: Greenwald et al., 1996 (pdf); new school: Benjamin et al., 2017). The best-known response, “Justify your alpha” (Lakens et al., 2017), calls instead for a flexible and openly justified standard of significance. It is not crystal clear what criteria should govern this flexibility, but we can take the “Justify” authors’ three downsides of adopting an alpha=.005 as potential reasons for using a higher alpha. There are problems with each of them.

Risk of fewer replication studies: “High-powered original research means fewer resources for replication.” Implicitly, this promotes a higher alpha for lower-powered exploratory studies, using the savings to fund high-powered replications that can afford a lower alpha (Sakaluk, 2016; pdf). Problem is, this model has been compared in simulations to just running well-powered research in the first place, and found lacking — ironically, by the JYA lead author. If evidence doesn’t care about the order in which you run studies, it makes more sense to run a medium-sized initial study and a medium-sized replication, than to run a small initial study and a large replication, because large numbers have statistically diminishing returns. The small study may be economical, but it increases the risk of running a large follow-up for nothing.

Risk of reduced generalizability and breadth: “Requiring that published research meet a higher threshold will push the field even more to convenience samples and convenient methods.” Problem is, statistical evidence does not care whether your sample is Mechanical Turk or mechanics in Turkey. We need to find another way to make sure people get credit for doing difficult research. There’s a transactional fallacy here, the same one you may have heard from students: “I pay so much tuition, worked so hard on this, I deserve a top grade!” Like student grades, research is a truth-finding enterprise, not one where you pay your money and get the best results. To be clear (spoiler ahoy!) I would rather accommodate difficult research by questioning what we consider to be a publishable result, rather than changing standards of evidence for a positive proposition.

Risk of exaggerating the focus on single p-values. “The emphasis should instead be on meta-analytic aggregations.” Problem is, this issue is wholly independent from what alpha you choose. It’s possible to take p = .005 as a threshold for meta-analytic aggregation of similar studies in a paper or even a literature (Giner-Sorolla, 2016; pdf), just as p = .05 is now the threshold for such analyses. And even with alpha = .05, we often see the statistical stupidity of requiring all individual results in a multi-study paper to meet the threshold in order to get published.

See, I do think that alpha should be flexible: not according to subjective standards based on traits of your research, but based on traits of your research audience.

Reis and Yee, in their quote at the top, are absolutely right that publishing is as much a communication as a truth-establishing institution. Currently, there is a context-free, one-size-fits-all publishing model where peer-reviewed papers are translated directly to press releases, news stories, and textbook examples. But I believe that the need to establish a hypothesis as “true” is most important when communicating with non-scientific audiences — lay readers, undergraduate students, policymakers reading our reports.  Specifically, I propose that in an ideal world there should be:

  • no alpha threshold for communications read by specialists in the field
  • a .05 threshold for reporting positive results aimed at research psychologists across specialties
  • a .005 threshold (across multiple studies and papers) for positive results that are characterized as “true” to general audiences

(Yes, firmly negative results should have thresholds too — else how would we declare a treatment to be quackery, or conclude that there’s essentially no difference between two groups on an outcome? But on those thresholds, there’s much less consensus than on the well-developed significance testing for positive results. Another time.)

No threshold for specialists. If you’re a researcher, think about a topic that’s right on the money for what you do, a finding that could crucially modify or validate some of your own findings. Probably, if the study was well-conducted, you would want to read it no matter what it found. Even if the result is null, you’d want to know that in order to avoid going down that path in your own research. This realization is one of the motivators towards increasing acceptance of Registered Reports (pdf), where the methods are peer-reviewed, and a good study can be published regardless of what it actually finds.

.05 threshold for non-specialist scientific audiences. Around researchers’ special field, there is an area of findings that could potentially inspire and inform our work. Social psychologists might benefit from knowing how cognitive psychologists approach categorization, for example. There may not be enough interest to follow null findings in these areas, but there might be some interest in running with tentative positive results that can enrich our own efforts. Ideally, researchers would be well-trained enough to know that p = .05 is fairly weak evidence, and treat such findings as speculative even as they plan further tests of them. Having access to this layer of findings would maintain the “creative” feel of the research enterprise as a whole, and also give wider scientific recognition to research that has to be low-powered.

.005 threshold for general audiences. The real need for caution comes when we communicate with lay people who want to know how the mind works–including our own undergraduate students. Quite simply, the lower the p-value in the original finding, the more likely it is to replicate. If a finding is breathlessly reported, and then nullified or reversed by further work, this undermines confidence in the whole of science. Trying to communicate the shakiness of an intriguing finding, frankly, just doesn’t work. As a story is repeated through the media, the layers of nuance fall away and we are left with bold, attention-grabbing pronouncements. Researchers and university press offices are as much to blame for this as reporters are. Ultimately, we also have to account for the fact that most people think about things they’re not directly concerned with in terms of “true”/”not true” rather than shades of probability. (I mean, as a non-paleontologist I have picked up the idea that, “oh, so T-Rex has feathers now” when it’s a more complicated story.)

Rjpalmer_tyrannosaurusrex_(white_background)
We’ve seen the bunny, now for the chickie.

I make these recommendations fully aware that our current communication system will have a hard time carrying them out. Let’s take the first distinction, between no threshold and alpha = .05. To be a “specialist” journal, judging from the usual wording of editors’ rejection letters, is to sit in a lower league to where unworthy findings are relegated. However, currently I don’t see specialist journals as any more or less likely to publish null findings than more general-purpose psychology journals. If anything, the difference in standards is more about what is considered novel, interesting, and methodologically sound. Ultimately, the difference between my first two categories may be driven by researchers’ attention more than by journal standards. That is, reports with null findings will just be more interesting to specialists than to people working in a different specialty.

On to the public-facing threshold. Here I see hope that textbook authors and classroom teachers are starting to adopt a stricter evidence standard for what they teach, in the face of concerns about replicability. But it’s more difficult to stop the hype engine that serves the short-term interests of researchers and universities. Even if somehow we put a brake on public reporting of results until they reach a more stringent threshold, nothing will stop reporters reading our journals or attending our conferences. We can only hope, and insist, that journalists who go to those lengths to be informed also know the difference between results that the field is still working on, and results that are considered solid enough to go public. I hope that at least, when we psychologists talk research among ourselves, we can keep this distinction in mind, so that we can have both interesting communication and rigorous evaluation.

The ACE Article and Those Confounded Effect Sizes

There is a kind of psychology research article I have seen many times over the past 20 years. My pet name for it is the “ACE” because it goes like this:

  • Archival
  • Correlational
  • Experimental

These three phases, in that order, each with one or more studies. To invent an example, imagine we’re testing whether swearing makes you more likely to throw things … via a minimal ACE article.

(To my knowledge, there is no published work on this topic, but mea culpa if this idea is your secret baby.)

First, give me an “A” — Archival! We choose to dig up the archives of the US Tennis Association, covering all major matches from 1999 to 2007. Lucky for us, they have kept records of unsporting incidents for each player at each match, including swearing and throwing the racket. Using multilevel statistics, we find that indeed, the more a player curses in a match, the more they throw the racket. The effect size is a healthy r = .50, p  < .001.

Now, give me a “C” — Correlational! We give 300 online workers a questionnaire, where we ask how often they have cursed in the last 7 days, and how often they have thrown something in anger in the same time period. The two measures are correlated r = .17, p = .003.

Finally, give me an “E” — Experimental! We bring 100 undergraduates into the lab. We get half of them to swear profusely for one full minute, the other half to rattle off as many names of fish as they can think of. We then let them throw squash balls against a target electronically emblazoned with the face of their most hated person, a high-tech update of the dart task in Rozin, Millman and Nemeroff (1986). And behold, the balls fly faster and harder in the post-swearing condition than in the post-fish condition, t(98) = 2.20, d=0.44, p = .03.

Aesthetically, this model is pleasing. It embraces a variety of settings and populations, from the most naturalistic (tennis) to the most constrained (the lab). It progresses by eliminating confounds. We start with two settings, the Archival and Correlational, where throwing and cursing stand in an uncertain relation to each other. Their association, after all, could just be a matter of causation going either way, or third variables causing both. The Experiment makes it clearer. The whole package presents a compelling, full-spectrum accumulation of proof for the hypothesis. After all, the results are all significant, right?

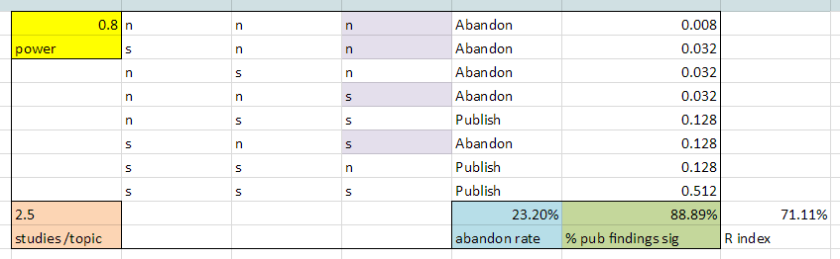
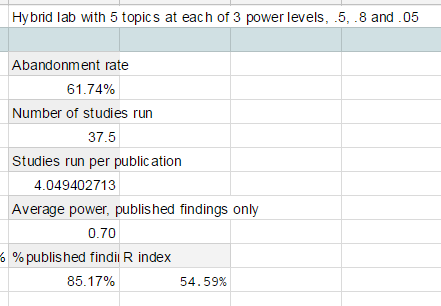
But in the new statistical era, we care about more than just the significance of individual studies. We care about effect size across the studies. Effect size helps us integrate the evidence from non-significant studies and significant ones, under standards of full reporting. It goes into meta-analyses, both within the article and on a larger scale. It lets us calculate the power of the studies, informing analyses of robustness such as p-curve and R-index.

Effect sizes, however, are critically determined by the methods used to generate them.  I would bet that many psychologists think about effect size as some kind of Platonic form, a relationship between variables in the abstract state. But effect size cannot be had except through research methods. And methods can:

  • give the appearance of a stronger effect than warranted, through confounding variables;
  • or obscure an effect that actually exists, through imprecision and low power.

So, it’s complicated to extract a summary effect size from the parts of an ACE. The archival part, and to some extent the correlational, will have lots of confounding. More confounds may remain even after controlling for the obvious covariates. Experimental data may suffer from measurement noise, especially if subtle or field methods are used.

And, indeed, all parts might yield an inflated estimate if results and analyses are chosen selectively. The archival part is particularly prone to suspicions of post-hoc peeking. Why those years and not other ones? Why thrown tennis rackets and not thrown hockey sticks? Why Larry the lawyer and Denise the dentist, but not Donna the doctor or Robbie the rabbi (questions asked of research into the name-letter effect; Gallucci, 2003, pdf)? Pre-registration of these decisions, far from being useless for giving confidence in archival studies, almost seems like a requirement, provided it happens before the data are looked at in depth.

The ACE’s appeal requires studies with quite different methods. When trying to subject it to p-curves, mini-meta-analyses (Goh, Hall & Rosenthal, 2016; pdf), or other aggregate “new statistics,” we throw apples and oranges in the blender together. If evidence from the experiment is free from confounds but statistically weak, and the evidence from the archival study is statistically strong and big but full of confounds, does the set of studies really show both strong and unconfounded evidence?

turk


The 18th century showman Wolfgang von Kempelen had a way to convince spectators there was no human agent inside his chess-playing “automaton”. He would open first one cabinet, then the other, while the human player inside moved his torso into the concealed parts. At no time was the automaton (yes, the famous “Mechanical Turk“)  fully open for view. Likewise, the ACE often has no study that combines rigorous method with robust finding. So, it’s hard to know what conclusions we should draw about effect size and significance on an article-wise level.

Leif Nelson at the Data Colada blog has recently taken a pessimistic view on finding the true effect size behind any research question. As he argues, the effect size has to take into account all possible studies that could have been run. So, evidence about it will always be incomplete.

Still, I think a resolution is possible, if we understand the importance of method. Yes, the best effect size takes into account both underlying effect and method used. But not all methods are equal. To have the clearest view of an underlying effect, we should focus on those methods that best meet the two criteria above: the least confounded with other factors, while at the same time being the most precise, sensitive, and free from error.

I said “possible,” not “easy.” For the first criterion, we need some agreement about which factors are confounds, and which are part of the effect.  For example, we show that science knowledge correlates with a “liberal”-“conservative” political self-report item. Then, trying to eliminate confounds, we covary out religious fundamentalism, right-wing authoritarianism, and support for big government. The residual of the lib-con item now represents a strange “liberal” who by statistical decree is just as likely as an equally strange “conservative” to be an anti-government authoritarian fundamentalist. In trying to purify a concept, you can end up washing it clean away.

Experimental methods make it somewhat easier to isolate an effect, but even then controversy might swirl around whether the effect has been whittled down to something too trivial or ecologically invalid to matter. A clear definition of the effect is also necessary in experiments. For example, whether you see implicit manipulations as the ultimate test of an effect depends on how much you see participant awareness and demand as part of the effects, or part of the problem. And are we content to look at self-reports of mental phenomena, or do we demand a demonstration of (messier? noisier?) behavioral effects as well? Finally, the effect size is going to be larger if you are only interested in the strength of an intervention versus no intervention — in which case, bring on the placebo effect, if it helps! It will usually be smaller, though, if you are interested in theoretically nailing down the “active ingredient” in that intervention.

The second criterion of precision is better studied. Psychometricians already know a lot about reducing noise in studies through psychometric validation. Indeed, there is a growing awareness that the low reliability and validity of many measures and manipulations in psychological research is a problem (Flake, Pek & Hehman, 2017, pdf). Even if the process of testing methods for maximum reliability is likely to be tedious, it is, theoretically, within our grasp.

But in a final twist, these two criteria often work against each other in research. Trying to reach good statistical power, it is harder to run large numbers of participants in controlled lab experiments than in questionnaire or archival data collections. Trying to avoid participant awareness confounds, implicit measures often increase measurement “noise” (Gawronski & De Houwer, 2014; Krause et al., 2011). This means it will be hard to get agreement about what method simultaneously maximizes the clarity of the effect  and its construct validity. But the alternative is pessimism about the meaning of the effect size, and a return to direction-only statistics.

I’ll conclude, boldly. It is meaningless to talk about the aggregate effect size in an ACE-model article, or to apply any kind of aggregate test to it that depends on effect sizes, such as p-curve. The results will depend, arbitrarily, on how many studies are included using each kind of method. A litmus test: would these studies all be eligible for inclusion in a single quantative meta-analysis? Best practice in meta-analysis demands that we define carefully the design of studies for inclusion, so that they are comparable with each other. Knowing what we know about methodology and effect size, the article, like the meta-analysis, is only a valid unit of aggregation if its studies’ methods are comparable with each other. The ACE article presents a compelling variety of methods and approaches, but that very quality is its Achilles’ heel when it comes to the “new statistics.”

Powering Your Interaction

With all the manuscripts I see, as editor-in-chief of Journal of Experimental Social Psychology, it’s clear that authors are following a wide variety of standards for statistical power analysis. In particular, the standards for power analysis of interaction effects are not clear. Most authors simply open up GPower software and plug in the numerator degrees of freedom of the interaction effect, which gives a very generous estimate.

I often hear that power analysis is impossible to carry out for a novel effect, because you don’t know the effect size ahead of time. But for novel effects that are built upon existing ones, a little reasoning can let you guess the likely size of the new one. That’s the good news. The bad news is: you’re usually going to need a much bigger sample to get decent power than GPower alone will suggest.

Heather’s Trilemma

Image result for music fast forward

Meet our example social psychologist, Heather. In an Experiment 1, she has participants listen either to a speeded-up or normal-tempo piece of mildly pleasant music. Then they fill out a mood questionnaire.  She wants to give her experiment 80% power to detect a medium effect, d = .5. Using GPower software, for a between-subjects t-test, this requires n = 64 in each condition, or N = 128 total.

The result actually shows a slightly larger effect size, d = .63. People are significantly happier after listening to the speeded-up music. Heather now wants to expand into a 2 x 2 between-subjects design that tests the effect’s moderation by the intensity of the music. So, she crosses the tempo manipulation with whether the music is mildly pleasant or intensely pleasant.

But there are three different authorities out there for this power analysis. And each is telling Heather different things.

  1. Heather assumes that the interaction effect is not known, even if the main effect is, so she goes with a medium effect again, d = .5. Using GPower, she tests the N needed to achieve 80% power of an interaction in this 2 x 2 ANOVA design, with 1 degree of freedom and f = .25 (that is, d = .5). GPower tells her that again, she needs only a total of 128, but now divided among 4 cells, for 32 people per cell. Because this power test of the interaction uses the same numerator df and other inputs as for the main effect, it gives the same result for N.
  2. Heather, however, always heard in graduate school that you should base factorial designs on a certain n per cell. Your overall N should grow, not stay the same, as the design gets more complex. In days of old, the conventional wisdom said n=20 was just fine. Now, the power analysis of the first experiment shows that you need over three times that number. Still, n=64 per cell should mean that you need N=256 people in the 2 x 2 experiment, not 128, right? What’s the real story?
  3. Then, Heather runs across a Data Colada blog post from a few years ago, “No-Way Interactions” by Uri Simonsohn. It said you actually need to quadruple, not just double, your overall N in order to move from a main effect design to a between-subjects interaction design. So Heather’s Experiment 2 would require 512 participants, not 256!

Most researchers at the time just shrugged at the Colada revelations (#3), said something like “We’re doomed” or “I tried to follow the math but it’s hard” or “These statistical maniacs are making it impossible to do psychology,” and went about their business. I can say with confidence that not a single one out of over 800 manuscripts I have triaged at JESP has cited the “No-Way” reason to use higher cell n when testing an interaction than a main effect!

But guess what? For most analyses in social psychology, answer #3 is the correct one. The “No-Way” argument deserves to be understood better. First, you need to know that the test of the interaction, by itself, is usually not adequate as a full model of the hypotheses you have. Second, you need to know how to estimate the expected effect size of an interaction when all you have is a prior main effect.

Power of a Factorial Analysis: Not so Simple

Answer #1, above (from basic power analysis) forgets that we are usually not happy just to see a significant interaction. No, we want to show more, that the interaction corresponds to a pattern of means that supports our conclusion. Here is an example showing that the shape of the interaction does matter, when you add in different configurations of main effects.

interactions

Result A shows the interaction you would get if Heather’s new experiment replicates the effect of tempo found in the old experiment when the music is mildly pleasant. For intensely pleasant music, there is no effect of tempo — a boundary condition limiting the original effect! The interaction coexists with a main effect of tempo, where faster music leads to better mood overall. Let’s say this was Heather’s hypothesis all along: the effect will replicate, but is “knocked out” if the music is too intense.

Result B also shows an interaction, with the same difference between slopes, and thus the same significance level and effect size. Intense is “less positive” than mild. But now the interaction is coexisting with two different main effects. Faster music worsens mood, and intense music improves it. Here, the mild version shows no effect of tempo on mood, and the intense version actually reduces mood with the fast vs. normal tempo. This doesn’t seem like such a good fit to the hypothesis!

Because these outcomes of the same interaction effect look so different, you need simple effects tests in order to fully test the stated hypotheses.  And yes, most authors know this, and duly present simple tests breaking down their interaction. But this means that answer #2 (n calculated per-cell) is more correct than answer #1 (N calculated by the interaction test). The more cells, the more overall N you need to adequately power the smallest-scale simple test.

Extending the Effect Size in a Factorial Analysis

That’s one issue. The other issue is how you can guess at the size of the interaction when you add another condition. This is not impossible. It can be estimated from the size of the original effect that you’re building the interaction upon, if you have an idea what the shape of the interaction is going to be.

Let’s start by asking when the interaction’s effect size is likely to be about the same as the original main effect size. Here I’m running a couple of analyses with example data and symmetrical means. If the new condition’s effect (orange dots) is the same size as the existing effect but in the other direction — a “reversal” effect — that’s when the interaction effect size, converted to d, is approximately the same as the original effect size. A power analysis of the interaction alone suggests you need about half as many participants per cell (n = 19!). That’s Heather’s answer #1. But, a power analysis of each of the simple effects — each as big as the original effect — suggests that you need about the same number per cell (n = 38), or twice as many in total. We’ve already established that the simple effects are the power analyses to focus on, and so it looks like Heather’s answer #2 is right in this case.

panel1
N(80) is the total sample to get 80% power, likewise for the interaction and simple effects.

Unfortunately, very few times in psychology do we add a factor and expect a complete reversal of the effect. For example, maybe you found that competent fellow team members in a competition are seen in a better light than incompetent ones. You add a condition where you evaluate members of the opposing team. Then you would expect that the incompetent ones would be more welcome, and the competent ones less so. That is the kind of situation you need in order to see a complete reversal.

However, it’s more usual that we expect the new condition to alter the size, rather than direction, of the existing effect. In the strongest such case, a new condition “knocks out” the old effect. Perhaps you found that men get more angry in a frustrating situation than women. Then you add a baseline condition (orange dots), a calm situation where you’d expect no gender differences in anger. The example shown below,  to the left, reveals that the interaction effect size here will be about half that of the original, strong gender effect. So, you need more power: roughly four times the number suggested by the mere GPower analysis of the interaction effect. This is Simonsohn’s recommendation too in the “knockout” case. But you can’t derive it using GPower, without realizing that your estimate of the interaction’s size has to be smaller than its constituent simple effect.

panels2
Again, the Ns to get 80% power for the interaction and for the largest simple effect are shown.

Even more typically, we might expect the new condition to attenuate but not completely knock out the effect. What if, even in a resting state, men express more anger than women? Let’s say that resting-state gender differences are about half the size of that shown when in a frustrated state. This is the example on the right, above.

It’s an interaction pattern that is not uncommon to see in published research. But it also has a very small interaction effect size, about 1/4 that of the simple effect in the “frustrated” state. As a result, the full design takes over 1,000 participants to achieve adequate power for the interaction.

I often see reports where a predicted simple effects test is significant but the overall interaction is not. The examples show why: in all but reversal effects, the simple effects tests require fewer people to get decent power than the interaction effects tests do. But the interaction is important, too. It is the test of differences among simple effects. If your hypothesis is merely satisfied by one simple effect being significant and another one not, you are committing the error of mistaking a “difference in significance” for a “significant difference.”

To sum up, the dire pronouncements in “No-Way Interactions” are true, but applying them correctly requires understanding the shape of the expected interaction.

  • If you expect the new condition to show a reversal, use a cell n equal to your original study, total N = 2x the original.
  • If you expect the new condition to knock out the effect, use a cell n twice that of your original study, for a total N = 4x the original.
  • If you expect only a 50% attenuation in the new condition, you really ought to use a cell n seven times that of your original study, for a total N = 14x the original! Yes, moderators are harder to show than you might think.

Take-home message: It is not impossible to estimate the effect size of a novel effect, if it builds on a known effect. But you may not like what the estimate has to say about the power of your design.


New Policies at JESP for 2018: The Why and How

As we found out starting in 2016, improving the scientific quality of articles in JESP, by requesting things such as disclosure statements or effect size reporting, means more work. More work for triaging editors, to check that the requried elements are there; and also for authors, if they get something wrong and have to revise their submission. To keep this work manageable, changes in publication practices at JESP proceed in increments. And with a new year, the next increment is here (announcement).

Briefly, from January 1 2018 we will:

  • No longer accept new FlashReports as an article format.
  • Begin accepting Registered Reports, or pre-registrations of Introduction sections and research plans prior to data collection which are sent to peer review, and are accepted, revised or rejected prior to knowing the study’s results. These may be replication or original studies. This format also includes articles where one or more studies are reported normally, and only the final study is in Registered Report format.
  • In all articles, require any hypothesis-critical inferential analyses to be accompanied by a sensitivity power analysis at 80%, that is, an estimate of the minimum effect size that the method can detect with 80% power. Sensitivity analysis is one of the options in the freely available software GPower (manual, pdf). It should be reported together with any assumptions necessary to derive power; for example, the assumed correlation between repeated measures.
  • Require that any mediation analyses either: explain the logic of the causal model that mediation assumes (for example, why the mediator is assumed to be causally prior to the outcome), or present the mediation cautiously, as a test of only one possible causal model.
  • Begin crediting the handling editor in published articles.

Ring out the Flash, ring in the Registered

It should come as no surprise that the journal is adopting Registered Reports, given my previous support of pre-registration (editorial, article). It may require more explanation why FlashReports are being discontinued.

As of January 2016 we emphasized that these short, 2500 word reports of research should not be seen as an easy way to get tentative evidence published, but rather an appropriate outlet for briefly reported papers that meet the same standards for evidence and theory development as the rest of the journal. Our reviewing and handling of FlashReports in the past two years has followed this model, and we also managed to handle FlashReports more speedily (by 3-4 weeks on average) than other article types.

With these changes, though, came doubts about the purpose of having a super-short format at all. It’s hard to escape the suspicion that short reports became popular in the 2000s out of embarrassment at the lag in publishing psychology articles on timely events. For example, after 9/11, some of the immediate follow-up research was still coming out in 2006 and later. Indeed, previous guidelines for FlashReports did refer to research on significant events.

But social psychology, unlike other disciplines (such as political science, which faces its own debates about timely versus accurate publishing), does not study historical events per se. Instead, they are examples that can illustrate deeper truths about psychological processes. Indeed, many FlashReports received in the past year dealt with the 2016 election or the Trump phenomenon, but didn’t go deep enough into those timely topics to engage with psychological theory in a generalizable way.

Few problems can be solved by a social psychologist racing to the scene. Our discipline has its impact on a longer, larger scale. We inform expert testimony, public understanding, and intervention in future cases. With this view, it becomes less important to get topical research out quickly, and more important to make sure the conclusions from it are correct, fully reported, replicable, and generalizable. While we still strive for timely handling of all articles, it makes less sense to promote a special “express lane” for short articles, and more sense to encourage all authors to report their reasoning, method, and analysis fully.

Sense and sensitivity

Over the past year, the Editors and I have noticed more articles that include a justification of sample size, even though it is not formally requested by our guidelines. This prompted us to reconsider our own requirements.

Many of us saw these sample size justifications as unsatisfactory on a number of counts. Sometimes, they were simply based on “traditional” numbers of participants (or worse yet, on the optimistic n=20 in Simmons et al., 2011, which the authors have decisively recanted). When based on a priori power analyses, the target effect size was often arrived at ad hoc, or through review of literatures known to be affected by publication bias. In research that tests a novel hypothesis, the effect size is simply not known. Attempts to benchmark using field-wide effect size estimates are unsatisfactory because methodology and strength of effects make effect sizes vary greatly from one research question to another (e.g. in Richard et al. 2003, the effect sizes of meta-analyses, themselves aggregating dozens if not hundreds of studies and methods, vary from near-zero to r = .5 and up). It is also sometimes seen that authors base their sample estimates on power analysis but fall short of those numbers in data collection, showing the futility of reporting good intentions rather than good results. In 2016, we saw these weaknesses as reasons not to make a requirement out of power analyses.

And yet it helps to have some idea of the adequacy of statistical power. Power affects the likelihood that any given p-value represents a true vs. false positive (as demonstrated interactively here.) More generally, caring about adequate power is part of the greater emphasis on method, rather than results, that I promoted in the 2016 editorial. A post-hoc power analysis, however, gives no new information above and beyond the exact p-value, which we now require; that is, a result with p = .05 always had about 50% power to detect the effect size actually found, 80% power always corresponds to p =.005 post-hoc, and so on.

As suggested by incoming Associate Editor Dan Molden, and further developed in conversations with current editors Ursula Hess and Nick Rule, the most informative kind of power analysis in a report is the sensitivity analysis, in which you report the minimum effect size your experiment had 80% power to detect. Bluntly put, if you are an author, we don’t want to make decisions based on your good intentions  (though you’re still welcome to report them), but rather, on the sensitivity of your actual experiment.

As before, there are no hard-and-fast guidelines on how powerful an experiment must be. The sensitivity of an experiment to reasonable effect sizes for social psychology will be taken into account, together with other indicators of methodological quality, and with some consideration of the difficuty of data collection. Our hope is that other journals will see the merit of shifting from reporting based on explaining intentions, to reporting based on the statistical facts of the experiment.

Mediation requires a causal model

The new policy on mediation is just a determination to start enforcing the warnings  already leveled at the use of this statistical practice in my 2016 editorial. To quote:

As before, we see little value in mediation models in which the mediator is conceptually very similar to either the predictor or outcome. Additionally, good mediation models should have a methodological basis for the causal assumptions in each step; for example, when the predictor is a manipulation, the mediator a self-reported mental state, and the outcome a subsequent decision or observed behavior. Designs that do not meet these assumptions can still give valuable information about potential processes through correlation, partial correlation, and regression, but should not use causal language and should interpret indirect paths with caution. We reiterate that mediation is not the only way to address issues of process in an experimental design.

In line with this, mediation analyses for JESP now have to either justify the causal direction of each step in the indirect path(s) explicitly using theory and method arguments, or include a disclaimer that only one of several possible models is tested. This standard also follows the recommendations made in a forthcoming JESP methods paper by Fiedler, Harris & Schott, which shows that mediation analyses published in our field almost never mention the causal assumptions that, statistically, these methods require. Again, it is our hope that this policy and its explanation will inspire other editors to take a second look at the use of mediation, especially in studies where the sophistication it lends is more apparent than real.

Scientific Criticism: Personal by Nature, Civil by Choice

Scientific criticism of psychology research is good. Bullying is bad. Between these two truisms lie a world of cases and a sea of disagreement. Look at the different perspectives described and shown in Susan Dominus’ article on Amy Cuddy, and Daniel Engber’s take, and Simine Vazire’s, and Andrew Gelman’s.

Talking about a “tone problem,” as in previous years, hasn’t worked. Worrying vaguely about overall tone seems petty. Everyone justifies their own approach. Few are repenting. The question needs to be sharpened: why do critics say things that seem reasonable to them, and unacceptably personal to some audiences?

In principle, it’s easy to insist on avoiding the ad hominem: “tackle the ball, not the player.” In practice, scientific criticism and testing have many reasons to veer into gray areas that leave the referees confused about where the ball ends and the foot begins. Here are some of them.

1. Who to critique? I see triage, you see resentment.

Asking for data, replicating studies–these are time-consuming activities. Checking everyone’s research is impossible. There are far more people producing than critiquing research. Since the start of the movement there has been a quest, backstage and quiet, to come up with rules governing whom to train the telescope on. Until this quest returns an answer, choices are going to be subjective, ill-defined, seemingly unfair.

Criticism is going to focus on results that are highly publicized. One, because they come to mind easily. Two, because the critic sees a special duty to make sure high-profile results are justified. But to the criticized, this focus can seem unfair, maybe even motivated by resentment of their success (or Nietzsche’s ressentiment). Naturally, it’s unlikely that a critic who investigates only high-profile results will have the same level of recognition as the results’ authors.

I endorse this authentic Mustache Fred quote.

Criticism is also going to focus on results that are surprising and implausible. Indeed, 5-15 years ago, there was considerable overlap between being high-profile and being surprising. “Big behavioral results from small input tweaks” was a formula for success in journals that prized novelty. Whether or not you think it’s fair to go after those examples might relate to what you think of the prior probability that a hypothesis is true. That probability, by definition, is lower the more implausible the effect is.

  • People who think prior probabilities are necessary in order to interpret positive evidence will agree that extraordinary claims require extraordinary evidence. This includes Bayesians, but also frequentists who understand that a significant p-value by itself is not the chance that you have made a type I error; you need priors to interpret the p-value as a “truth statistic” (see Ioannidis, 2005 and this widget).
  • If you don’t get this point of statistics, you will probably lean toward seeing an equal-tolerance policy as more fair. Surely, all findings should be treated alike, no matter how supported they are by precedent and theory. By this standard, focusing on surprising findings looks like at least a scientific-theoretical bias, if not a personal one. You may wonder why the boring, obvious results don’t get the same level of scrutiny.

2. Are your results your career? Maybe they shouldn’t be, but they are.

In addressing bad incentives in science, I sometimes hear that the success of a scientist’s career should not depend on whether their research gives hypothesis-confirming results. But this has never been the case in science and is unlikely ever to be. If a scientist has a wrong idea that is later shot down by more evidence, their stature is diminished. After all, if being right is not important to the personal reputation of a scientist, what incentive is there to be right?

Let’s not be naive. Science careers have been increasingly precarious and competitive, making it hard for a scientist to “merely live” with null or nullified results. Tenure, grant and hiring standards at the highest levels make it necessary for a scientist to be personally identified with a substantial, positive, and influential line of research. Criticism that leads to doubt about published work is a career threat, like it or not. Under these conditions, the scientific is inherently personal.

3. What to do in the face of impunity?

When impersonal, procedural justice fails to deliver results, there is a strong pull to deliver personal, frontier justice. Now when it comes to scientific error in psychology, or worse yet misconduct, who exactly is the law? Universities are often vested in maintaining the reputations of their good grant-getters (but, as with free speech issues, happy to throw temporary faculty under the bus.) Not all researchers belong to professional organizations that enforce an ethics code. Funders take some interest in research misconduct, but not all research is funded. Journal editors have leverage with retractions, corrections, and expressions of concern, but this is itself a form of sheriff law, with very different results depending on the editor’s opinion, and very few investigative powers on its own.

Having to rely on sheriff law, mob law, or vigilante law, frankly sucks. There’s very little stopping this kind of justice from being capricious, unaccountable, unjust. Batman, Dirty Harry and the Bad Lieutenant are all in the same game. Historically, sociologically, what makes this kind of justice go away is the establishment of reliable, accountable institutions that police integrity. Institutions that are empowered not just to find smoking guns pointing to misconduct, but to close a raftload of loopholes that allow evidence to be concealed or destroyed with impunity.

Until that happens, justice is stuck in the Middle Ages, with judicial duels involving vested persons rather than impartial institutions. With nobody responsible for bringing clear charges, accusations confuse sloppiness, overstatement, and outright fraud, just as Batman punishes serial killers and truant kids alike. Even posse members get the blues about this, sometimes.

Image result for batman stay in school
Snyder & Capullo, Batman 51

Criticize, with civility

If criticism in today’s science, for all these reasons, is going to have personal resonance, the rule “avoid anything that seems like a personal attack” is not going to cut it.

(I know some of you think it is wrong to put any community standards on what can be said. This discussion is not for you, and we are all now free to call you someone who really gets off on being an asshole. Shh! Don’t complain.)

For the rest of us, I propose that civil discourse means we treat other scientists as people of good character who are gravely mistaken. Even when we suspect that they are not people of good character. Especially when we suspect this; otherwise we are merely being nice to people we like.

Assuming good character means, concretely, this:

  • Confine your public observations to judging their words and behaviors.
  • Don’t try to get inside their head; avoid claims like “He must really want to tear down science” or “She just loves to pull off these tricks.”
  • Don’t try to paint their character with a label. People are uncannily good at making inferences from actions. “Con artist,” “shady,” “zealot,” all go over the top. They inflame, when your evidence should be enough.
  • Do all this even when you are itching to land them a zinger, even when you want everyone to rise up in arms behind your call. You have great freedom in highlighting and arranging the facts; that freedom can be challenged, and answered rationally. Let the case speak for itself.

The Lab-Wise File Drawer

The file drawer problem refers to a researcher failing to publish studies that do not get significant results in support of the main hypothesis. There is little doubt that file-drawering has been endemic in psychology. A number of tools have been proposed to analyze excessive rates of significant publication and suspicious patterns of significance (summarized and referenced in this online calculator). All the same, people disagree about how seriously the file-drawer distorts conclusions in psychology (e.g. Fabrigar & Wegener in JESP, 2016, with comment by Francis and reply). To my mind the greater threat of file-drawering noncompliant studies is ethical. It simply looks bad, has little justification in an age of supplemental materials that shatter the page count barrier, and violates the spirit of the APA Ethics Code.

But I’ll bet that all of us who have been doing research for any time have a far larger file drawer composed of whole lines of research that simply did not deliver significant or consistent results. The ethics here are less clear. Is it OK to bury our dead? Where would we publish whole failed lines of research?

Of course, some research topics are interesting no matter how they come out. As I’ve argued elsewhere, focusing on questions like these would remove a lot of uncertainty from careers and undercut the careerist motivation for academic fraud. But would even the most extreme advocate of open science reform back a hard requirement for a completely transparent lab?

The lab-wise file drawer rate — if you will, the circular file drawer — could explain part or all of publication bias. Statistical power could lag behind the near-unanimous significance of reported results due to whole lines of research being file-drawered. The surviving lines of research, even if they openly report all studies run, would then look better than chance would have it. I ran some admittedly simplistic simulations (Google Drive spreadsheet) to check out how serious the circular file drawer can get.

circular-file-drawer
File, circular, quantity 1


Our simulated lab has eight lines of research going on, testing independent hypotheses with multiple studies. Each study has 50% power to find a significant result given the match between its methods and the actual, population effect size out there. You may think this is low, but keep in mind that even if you build in 80 or 90% power to find, say, a medium sized effect, the actual effect may be small or practically nil, reducing your power post-hoc.

The lab also follows rules for conserving resources while conforming to the standard of evidence that many journals follow. For each idea, they run up to three studies. If two studies fail to get a significant result, they don’t publish the research. They also stop the research short if either they fail to replicate a promising first study, or they try two studies, both of which fail. In this 50% power lab where each study’s success is a coin flip, this means that out of eight lines of research, they will only end up trying to publish three. Sounds familiar?

Remember, all these examples  assume that the lab reports even non-significant studies from lines of research that “succeed” by this standard. There is no topic-wise file drawer — only a lab-wise one.

In our example lab that runs at a consistent 50% power, at the spreadsheet’s top left, the results of this practice look pretty eye-opening. Even though not all reported results are significant, the 77.8% that are significant still exceed the 50% power of the studies. This leads to an R-index of 22, which has been described as a typical result when reporting bias is applied to a nonexistent effect (Schimmack, 2016).

labwise1

Following the spreadsheet down, we see minimal effects of adopting slightly different rules that are more or less conservative in abandoning a research line after failure. They only require one study more or less about every 4 topics, and the R-indices from these analyses are still problematic.

Following the spreadsheet to the right, we see stronger benefits of carrying out more strongly powered research — which includes studying effects that are more strongly represented in the population to begin with. At 80% power, most research lines yield three significant studies, and the R-index becomes a healthy 71.

labwise2

The next block to the right assumes only 5% power – a figure that breaks the assumptions of the R index. This represents a lab that is going after an effect that doesn’t exist, so tests will only be significant at the 5% type I error rate. Each of the research rules is very effective in limiting exposure to completely false conclusions, with only one in hundreds of false hypotheses making it to publication.

Before drawing too many conclusions about the 50% power example, however, it is important to question one of its assumptions. If all studies run in a lab have a uniform 50% power, and use similar methods, then all the hypotheses are true, with the same population effect size. Thus, variability in the significance of studies cannot reflect (nonexistent) variability in the truth value of hypotheses.

To reflect reality more closely, we need a model like the one I present at the very far right. A lab uses similar methods across the board to study a variety of hypotheses: 1/3 hypotheses with strong population support (so their standard method yields 80% power), 1/3 with weaker population support (so, 50% power), and 1/3 hypotheses that are just not true at all (so, 5% power). This gives the lab’s publication choices a chance to represent meaningful differences in reality, not just random variance in sampling.

What happens here?

labwise3

This lab, as expected, flushes out almost all of its tests of nonexistent effects, and finds relatively more success with research lines that have high power based on a strong effect, versus low power based on a weaker effect. As a result, inflation of published findings is still appreciable, but less problematic than if each study is done at a uniform 50% power.

To sum up:

  1. A typical lab might expect to have its published results show inflation above their power levels even if it commits to reporting all studies relevant to each separate topic it publishes on.
  2. This is because of sampling randomness in which topics are “survivors.” The more a lab can reduce this random factor — by running high-powered research, for example — the less lab-wise selection creates inflation in reported results.
  3. A lab’s file drawer creates the most inflation when it tries to create uniform conditions of low power — for example, trying to economize by studying strong effects using weak methods and weak effects using strong methods, so that a uniform post-hoc power of 50% is reached (as in the first example). It may be better to let weakly supported hypotheses wither away (as in the hybrid lab example).

And three additional observations:

  1. These problems vanish in a world where all results are publishable because research is done and evaluated in a way that reflects confidence in even null results (for example, the world of reviewed pre-registration). Psychology is a long way from that world, though.
  2. The labwise file drawer adds another degree of uncertainty when trying to use post-hoc credibility analyses to assess the existence and extent of publication bias. Some of that publication bias may come from the published topic being simply more lucky than other topics in the lab.
  3. If people are going to disagree on the implications, a lot of it will hinge on whether it is ethical to not report failed lines of research. Those who think it’s OK will see a further reason not to condemn existing research, because part of the inflation used as evidence for publication bias could be due to this OK practice. Those who think it’s not OK will press for even more complete reporting requirements, bringing lab psychology more in line with practices in other lab sciences (see illustration).

    lab_notebook_example2
    Being trusted is a privilege.


APA Ethics vs. the File Drawer

These days, authors and editors often complain about a lack of clear, top-down guidance on the ethics of the file-drawer. For many years in psychology, it was considered OK to refrain from reporting studies in a line of research with nonsignificant key results. This may sound bad to your third-grader, to Aunt Millie, or to Representative Sanchez. But almost everyone did it.

The rationales have looked a lot like Bandura’s inventory of moral disengagement strategies (pdf): “this was just a pilot study” (euphemistic labeling), “there must be something wrong with the methods, unlike these studies that worked” (distortion of consequences — unless you can point to evidence the methods failed, independently of the results),  “at least it’s not fabrication” (advantageous comparison), and of course, “we are doing everyone a favor, nobody wants to read boring nonsignificant results” (moral justification).

Bandura would probably classify “journals won’t accept anything with a nonsignificant result” as displacement of responsibility, too. But I see journals as just the right and responsible place to set standards for authors to follow. So, as Editor-in-Chief, I’ve let it be known that JESP is open to nonsignificant study results, either as part of sampling variation in a larger pattern of evidence, or telling a convincing null story thanks to solid methods.

That’s the positive task, but the negative task is harder. How do we judge how much a body of past research, or a manuscript submitted today, suffers from publication bias? What is the effect of publication bias on conclusions to be drawn from the literature? These are pragmatic questions. There’s also ethics: whether, going forward, we should treat selective publication based only on results as wrong.

Uli Schimmack likens selective publication and analysis to doping. But if so, we’re in the 50-year period in the middle of the 20th century when, slowly and piecemeal, various athletic authorities were taking first steps to regulate performance-enhancing drugs. A British soccer player buzzed on benzedrine in 1962 was not acting unethically by the regulations of his professional body. Imagine referees being left to decide at each match whether a player’s performance is “too good to be true” without clear regulations from the professional body. This is the position of the journal editor today.

Or is it? I haven’t seen much awareness that the American Psychological Association’s publication manuals, 5th (2003) and 6th (2010) edition, quietly put forward an ethical standard relevant to selective publication. Here’s the 6th edition, p. 12. The 5th edition’s language is very similar.

apa4

Note that this is an interpretation of a section in the Ethics Code that does not directly mention omission of results. You could search the Ethics Code without finding any mention of selective publication, which is probably why this section is little known. Here’s 5.01a below.

apa6

Also getting in the way of a clear message is the Publication Manual’s terse language. “Observations” could, I suppose, be narrowly interpreted to mean dropping participants ad hoc from a single study just to improve the outcome. If you interpret “observations” more broadly (and reasonably) to mean “studies,” there is still the question of what studies a given report should contain, in a lab where multiple lines of research are going on in parallel. There is room to hide failed studies, perhaps, in the gap between lines.

But I don’t think we should be trying to reverse-engineer a policy out of such a short a description. See it for what it is: a statement of the spirit of the law, rather than the letter. Even if you don’t think you’re being “deceptive or fraudulent,” just trying to clarify the message our of kindness to your reader, the Publication Manual warns against the impulse “to present a more convincing story.” There can be good reasons for modifying and omitting evidence in order to present the truth faithfully. But these need to be considered independent of the study’s failure or success in supporting the hypothesis.

One last numbered paragraph. This is the relevant section of the Ethical Principles (not the Publication Manual) that authors have to sign off on when they submit a manuscript to an APA journal.

apa7

What would be the implications if the APA’s submission form instead used the exact language and interpretation of 5.01a from its own most recent Publication Manual? Explosive, I think. Using the APA’s own official language, it would lay down an ethical standard for research reporting far beyond any of the within-study reporting measures I know about in any journal of psychology. It would go beyond p-curving, R-indexing and “robustness” talk after the fact, and say out loud that file-drawering studies only because they’ve failed to support a hypothesis is unethical. Working out reasonable ways to define that standard would then be an urgent next step for the APA and all journals who subscribe to its publication ethics.

Quadratic Confounds, Linear Controls: A Doubt About That “Air Rage” Study

This past week it was hard to miss reading about the “air rage” study by Katherine DeCelles and Michael Norton, published in PNAS. They argued that economy-class passengers exposed to status inequalities when the flight had a first-class section were more likely to become belligerent or drunk — especially when the airplane boarded from the front and they had to walk right by those first-class 1%-ers in their sprawling leather seats. (article; sample news report).

Sounds compelling. But Andrew Gelman had doubts, based on some anomalies in the numbers and the general idea that it is easy to pick and choose analyses in an archival study. Indeed, for much research, one can level the critique that researchers are taking advantage of the “garden of forking paths”, but it’s harder to assess how much the analytic choices made could actually have influenced the conclusions.

This is where I found something interesting. In research that depends on multiple regression analysis, it’s important to compare zero-order and regression results. First, to see whether the basic effect is strong enough, so that the choices made for which variables to control for wouldn’t impact the results too much. Second, to see whether the conclusions being drawn from the regression line up with the zero-order interpretation of the effect that someone not familiar with regression would likely draw.

It’s already been remarked that the zero-order stats for the walk-by effect actually show a negative correlation with air rage; the positive relationship comes about only when you control for a host of factors. But the zero-order stats for the basic first-class air rage effect on economy are harder to get clear in the report. In the text, they are reported in raw, absolute numbers: over ten times as many air rage incidents occur on a yes/no basis in economy class when first class is present compared to when it is not. However, these raw numbers are naturally confounded by two factors that are highly correlated with the presence of a first class (see table S1 in the supplementary materials): length of flight and number of seats in economy. So you have to control for that in some way.

There was no data on actual number of passengers, but number of seats was used as a proxy for number of passengers, given that over 90% of flights are typically fully sold on that airline. In the article, number of seats and flight time are controlled for together, entered in the paper’s regression analysis on raw incident numbers per-flight. Not surprisingly, seats and time are correlated highly, nearly .80 (bigger planes fly longer routes), so including one after the other will not improve prediction much.

But most importantly, this approach doesn’t reflect that the effect of time and passenger numbers on behavioral base rates is multiplicative. That is, the raw amount of any kind of incident on a plane is a function of the number of people times the length of the flight, before any other factors like first class presence come into play. So what you need to do to model the rate of occurrence is  introduce an interaction term multiplying those two numbers – not just entering the two as predictors.

Or to put it another way – the analysis they reported might give a much lower effect of first class presence if they had taken as their outcome variable the proportion of air rage incidents per seat, per flight hour, because the outcome is still confounded with the size/length of the flight if you just control for the two of them in parallel.

Still confused? OK, one more time, with bunnies and square fields.

Rabbit fields

Although the data are proprietary and confidential, I would really appreciate seeing an analysis either controlling for the interaction of time and seats, or dividing the incidents by the product of time and number of seats before they go in as DVs, to arrive at the reasonable outcome of incidents per person per hour.

One other thing. Beyond their mere effects on base rates, long hours and many passengers may each affect raw numbers of air rage in a more exponential way – each with a quadratic function – by also leading to higher rates of incidents, even per person per hour, through higher numbers of potential interactions, and flight fatigue. So ideally, if you’re keeping raw numbers as the DV, the quadratic as well as linear functions of passenger numbers and flight time need to be modeled.

So the bottom line here for me is not that the garden of forking paths is in play, but that the wrong path appears to have been taken. I look forward to any feedback on this – especially from the authors involved.

My JESP Inaugural Editorial

A short break from the editors’ forum questions: I’m not sure I’ve given proper publicity to my editorial, which according to the cellulose-based publication schedules is “coming out” in the “July issue” but is now accessible – openly, as far as I can tell. So here: publicity.

If you want the take-home summary about “the crisis” here it is, in bold, with a little commentary:

1. I would rather not set out hard standards for the number of participants in a study or condition.  I don’t think our field has done the theory and method development to support those kind of standards.

I would rather indirectly reward the choice to study both higher N and higher effect sizes, by putting more weight on strong rather than just-significant p-values, while recognizing that sometimes a true, and even strong, effect is represented in a multi-study sequence by a non-significant p-value. So…

2. I do like smarter use of p-values. I want people to look at research with a full awareness of just how much p-values vary even when testing a true effect with good power.

This means not playing the game of getting each study individually significant, and being able to present a set of studies that represent overall good evidence for an effect regardless of what their individual p-values are.

If I could be sure that a multi-study paper contained all studies run on that topic, including real evidence on why some of them were excluded because they were not good tests of the hypothesis, then I could express a standard of evidence in terms of some combined p-value using meta-analytic methods. I suggest a p < .01 but my original impulse (and an opinion I received from someone I respect a lot soon after the editorial came out) was for p < .005. I suggest this very lightly because I don’t want it to crystallize into the new p < .05, N =200, p-rep > .87 or whatever. It’s just based on the approximate joint probability of two results p < .10 in the same direction.

If, if, if. There’s also the question of how many nonsignificant tests go into the file drawer behind any multi-study paper. Given our power versus our positive reporting rate and other indicators there’s no doubt that many do. The reactions that I have seen range from “hey, business as usual” to “not ideal but probably doesn’t hurt our conclusions much” to “not cool, let’s do better” to “selective reporting is the equivalent of fraud.” If I could snap my fingers and get the whole field together on one issue it would be this, naturally, ending up at my personally preferred position of “not cool.”

But until we have a much better worked out comparison of all the different methods out there, it’s hard to know how effectively gatekeepers can deduce when a research report has less evidence than it claims, because of that file drawer. I’m not the only one who would rather have people feel free to be more complete a priori research reporters, than have to write back with “Your article with four studies at p = .035, p = .04, p = .045 and p = .0501 (significant (sic)) looks, um, you know …”  Erika Salomon has taken the first step but, clearly, the last word is far from written.

Anyway, one of the goals of this blog is to open up a debate and lay out both the ethical and the pragmatic issues about this most divisive of litmus tests in the field today – should we worry about the file drawer? So stay tuned.